
BTCUSD Holds Near $110,500 Amid Fed Rate Cut and Upcoming CPI Data
Bitcoin (BTCUSD) is currently consolidating near the $110,500 mark, reflecting cautious investor sentiment after the U.S. Federal Reserve’s 25-basis-point rate cut. Despite the initial enthusiasm surrounding improved macro sentiment and new cryptocurrency ETF listings, BTC experienced notable losses in late October, as traders digested Fed Chair Powell’s cautious remarks and renewed dollar strength. The crypto market now faces a delicate short-term technical setup, where support levels, resistance zones, and macro catalysts will determine the next directional move.
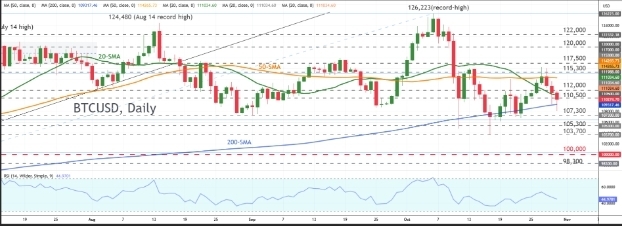
After touching an intraday low of $108,091, Bitcoin has declined over 4% this week. The broader crypto market mirrored this weakness, shedding nearly $100 billion in value. Ether (ETHUSD) and large-cap altcoins such as XRP and Solana each fell by 4% or more, reflecting investor repositioning ahead of upcoming U.S. CPI data. BTCUSD is testing key support at the 200-day SMA near $109,317, with an additional pivot around $107,300 — a level that has held since July. Immediate resistance sits at $111,048 (20-day SMA) and $114,266 (50-day SMA), while the Relative Strength Index (RSI) remains below 50, indicating fading short-term momentum.
One notable development has been the growing divergence between Bitcoin and traditional risk assets. While the S&P 500 and Nasdaq 100 reached fresh highs, BTC’s correlation with these indices fell to 0.43 and 0.39 respectively. This indicates that Bitcoin’s short-term drivers are becoming increasingly idiosyncratic, responding more to liquidity dynamics, derivatives positioning, and leveraged flows than to broader equity trends. Historically, such divergence occurs during periods when traders anticipate the “final Fed cut,” with expectations of slower liquidity injections and tighter year-end financial conditions.
Institutional flows have also shifted. Following several weeks of strong ETF inflows, net outflows of $470.7 million occurred in Bitcoin spot ETFs post-Fed, while Ether ETFs experienced outflows of $81.4 million. Leveraged futures liquidations totaled $817 million over the past 72 hours, disproportionately affecting long traders. Open interest on major derivatives exchanges declined 12% week-over-week, signaling a risk de-leveraging phase that typically precedes a consolidation period of 7–10 days before potential upside returns.
Technically, BTCUSD maintains a long-term bullish structure, holding above its 200-day SMA despite short-term weakness. Price action remains compressed between the 20- and 50-day SMAs, forming a potential coil that could resolve with directional volatility. A sustained move above $111,000 with increased volume could open the path to $114,200 and $115,500, while a decisive break below $109,000 may accelerate losses toward $107,300 and $105,800, the next major support from August’s swing low. RSI near 45 indicates mild bearish bias but not oversold conditions, while exchange inflows have slowed 6% since mid-October, reducing immediate sell pressure. Miners continue holding stable reserves, suggesting no panic selling from production participants.
Smaller-cap altcoins experienced sharper declines, reflecting a rotation back to Bitcoin dominance — a common sign of risk aversion during uncertain market phases. This consolidation often precedes renewed upside when macro catalysts or liquidity conditions shift favorably.
Inside Eastleigh Chaos
Fundamentally, Bitcoin’s trajectory in the coming two weeks will hinge on the U.S. CPI release and macroeconomic sentiment. Analysts anticipate a year-on-year reading near 3.5%, slightly down from 3.7%. A softer print could weaken the dollar and boost BTC, whereas stronger-than-expected data could pressure Bitcoin and extend its consolidation. Macro tailwinds, including improved U.S.-China trade relations and easing geopolitical risks in the Middle East, provide some upside potential. However, traders are cautioned against excessive leverage, as recent volatility has highlighted speculative fragility.
Crypto-exposed equities, such as Coinbase and MicroStrategy, have mirrored Bitcoin’s downward moves, underlining sentiment-driven interconnections between digital assets and public companies. ETF and institutional flows suggest temporary reallocation into more liquid assets, increasing Bitcoin dominance while smaller coins face amplified volatility. This dynamic reinforces BTC’s status as the market bellwether, guiding sentiment for the broader crypto landscape.
Looking at November’s short-term outlook, BTCUSD may oscillate within a $108,000–$115,000 corridor, awaiting confirmation of macro data and technical triggers to define year-end direction. Traders should monitor liquidity, derivative positioning, and macroeconomic indicators closely, as volatility spikes could produce trading opportunities for disciplined participants.
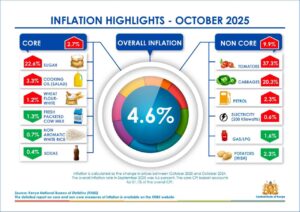
Kenya Inflation Data: October 2025 Review
Overall, Bitcoin’s technical and fundamental setup suggests cautious optimism. Key resistance levels at $111,000 and $114,266 must be overcome for a sustained rally, while support at $109,317 and $107,300 remains critical for maintaining bullish long-term bias. Traders and investors should combine technical indicators, macroeconomic analysis, and risk management to navigate this range-bound market, anticipating potential breakouts upon CPI or liquidity surprises. Reliable sources like CoinDesk, Investing.com BTCUSD charts, Reuters Crypto News, and CNBC Bitcoin Coverage provide continuous updates for informed trading decisions.
This analysis was prepared by the Ramsey Focus Crypto Desk, using verified technical charts, macroeconomic data, and market commentary for professional trading insights.


One Response